Discovering the Hidden Cost of Quality
The cost of quality is far greater than most business are aware of. But what are the hidden quality costs and how do you fix or prevent them?
Quality is one of the most important metrics in the business world, yet also one of the most undervalued. Most executives understand that poor quality has a cost associated to it. However, the true depth of how much quality actually costs is far greater than most businesses understand. In fact, most traditional understanding of the cost of quality comes from the idea that improving quality is expensive.
Executives are faced with making decisions based on data. However, this data involves the participation of key members of a company such as supply chain managers, manufacturing engineers, sales, product marketing, and especially customer service teams.
This article provides considerations to help understand the true hidden cost of quality. Additionally, ways in which to uncover tangible methods of quantifying the hidden costs of quality and gaining immediate attention at the executive level.

Table of Contents

The Categories of Quality
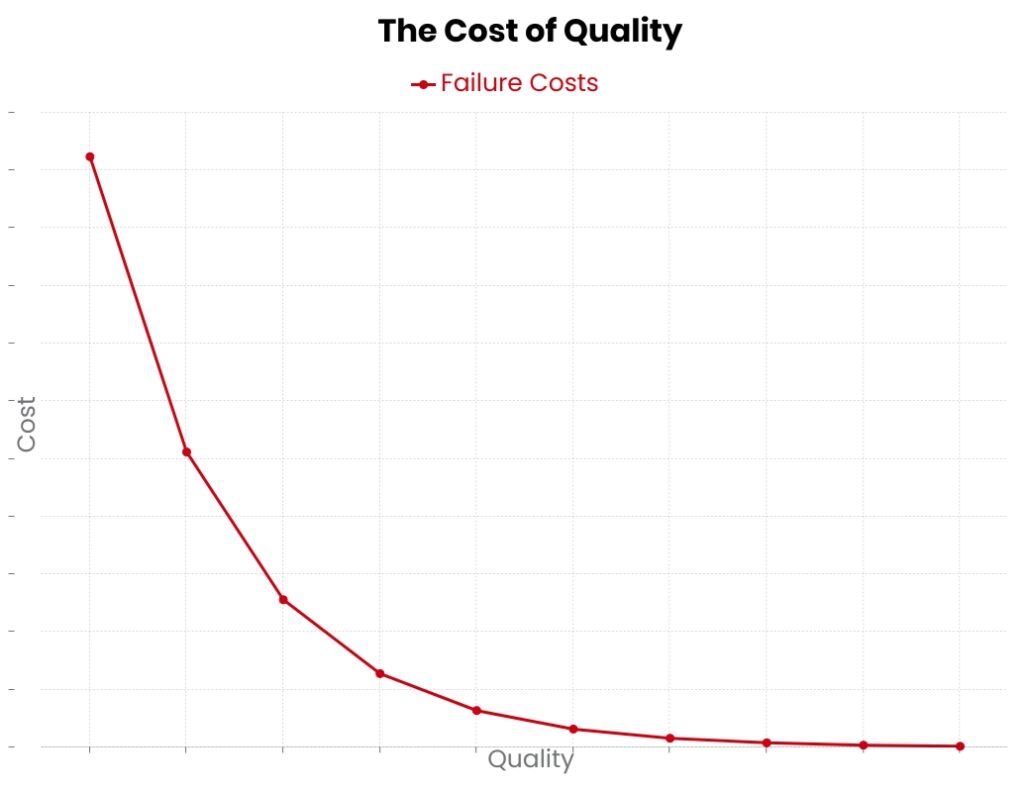
While attempting to quantify the cost of quality, many companies start with a list similar to the one below. These examples are a type of cost that is a loss experienced because of poor quality, otherwise known as “Failure Costs”.
A failure cost is the cost attributed directly to poor quality. Failure cost is sometimes also called the cost of poor quality (COPQ).
Examples of Failure Costs:
- Waste
- Rejects
- Reworks
- Returns
- Recalls
- Warranty Claims
- Reputation
- Lost Sales & Customers
Failure costs break down into two sub-categories, “Internal” and “External” failure costs. Internal failure costs are easy to quantify. This is because their identification happens before the product delivers to the customer. However, there are still hidden costs in this category.
Internal failure costs include things such as lost production time, a bottleneck in your operations. This bottleneck can add cost from additional time in each step in your operational functions or department. In the graph, failure costs decrease as quality increases.
Internal Failure Costs
An internal failure cost is the cost to correct product nonconformities, defects, or other quality related problems before delivery to the customer. Examples of internal failure cost include:
• Waste
• Rejects
• Reworks
• Lost production time
External Failure Costs
An external failure cost is the cost to correct product nonconformities, defects, or other quality related problems after delivery to the customer. Examples of external failure cost include:
• Returns
• Recalls
• Warranty Claims
• Reputation
• Lost Sales & Customers
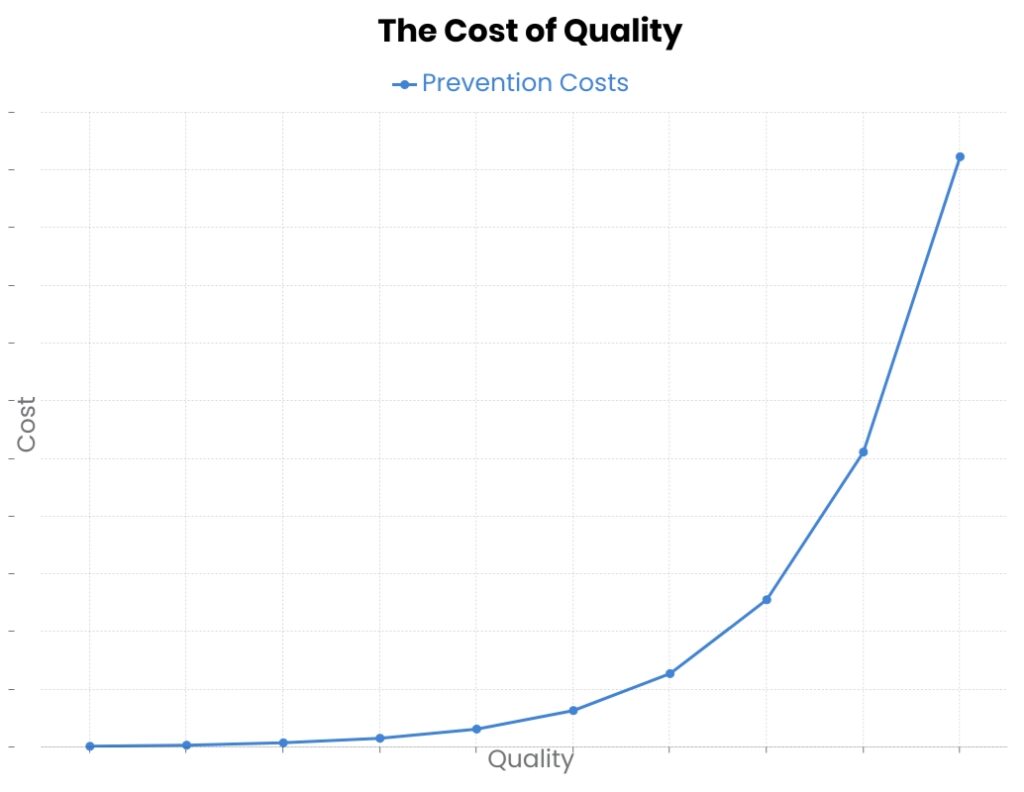
Prevention Costs
The other type of cost of quality is “Prevention Cost.” Prevention cost is any cost a business incurs to prevent poor quality problems. It may include investments associated with increasing quality. Prevention cost is sometimes also called cost of good quality (COGQ). Examples of prevention costs include:
- Equipment
- Training
- Supplier Management
- Employee Management
- Design Improvements
The chart below illustrates the relationship of prevention costs vs quality results. Notice prevention costs increase as you increase your quality.
The Snowball Effect of Cost of Poor Quality
Prevention costs are tangible and easily identified. So, creating a graph with data that represents those results is relatively simple. However, the data behind failure costs (the hidden ones) are more difficult to find and almost always undervalued or overlooked.
In the case of a product return for example, a detailed analysis of not only tangible cost of the product, but each operation associated with processing the return will uncover the true cost. That may include a service team member, logistics team member, approval from a manager, product team analysis, the services of materials recycling or liquidation. It also may include other effects of processing that return on your supply chain such as excess inventory, expediting costs, and premium freight costs.
Following the Cost of Quality Curve
As the snowball begins to travel down the slope, it gains momentum in the form of new hidden costs that affect the supply chain. This results in a drop in sales and more unsatisfied customers. These unsatisfied customers add to the snowball, adding lost production time.
This is where the cost of quality (COQ) can spiral out of control costing more to sell the product than the revenue it generates. Here, the product cost is usually substantially higher than the market value resulting in low demand.
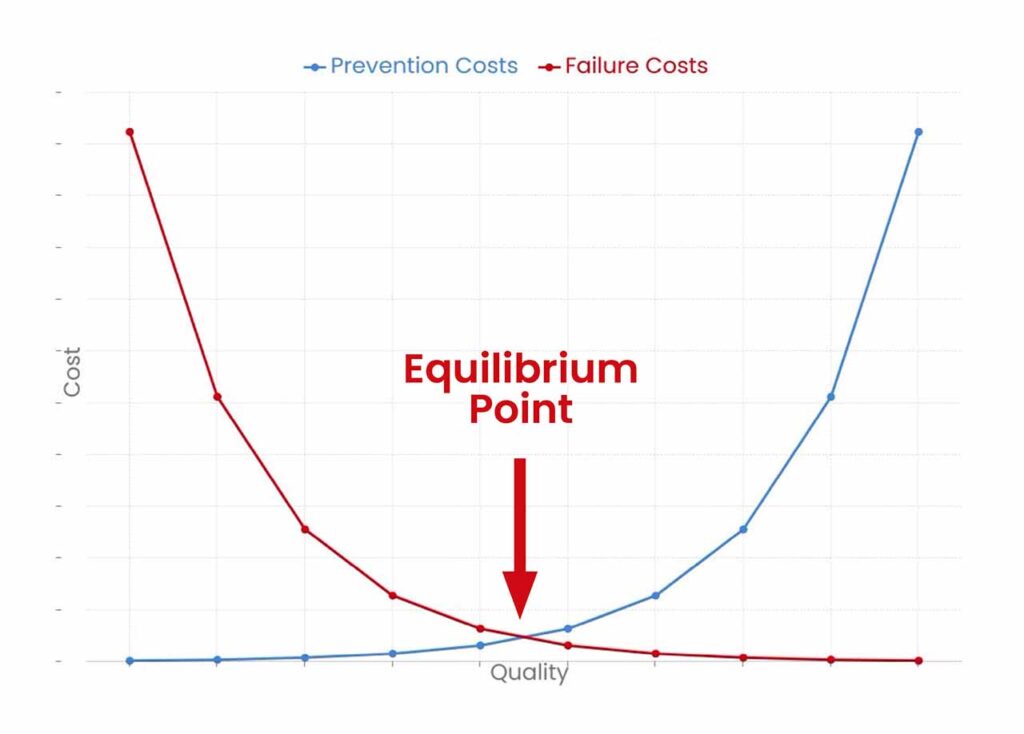
The Cost of Quality Equilibrium Point
Investing earlier in preventative costs yields higher demand and market value. Eventually, the preventative costs no longer serve to increase the profitability of a product and reach an equilibrium point. This is also sometimes referred to as the law of diminishing returns.
The Point of Maximum Profit
At first glance, it seems that the optimum place for the cost of quality is directly in the center of the curve where the two lines meet. True, this is the point at which the lowest cost and best quality meet, but not the point of maximum profitability.
Because of higher quality and better reliability, you can charge more for your product as you move up the scale. Additionally, most companies are not fully realizing the full extent of the failure costs associated with poor quality. This means you can move higher on the prevention costs scale while simultaneously increasing profit.
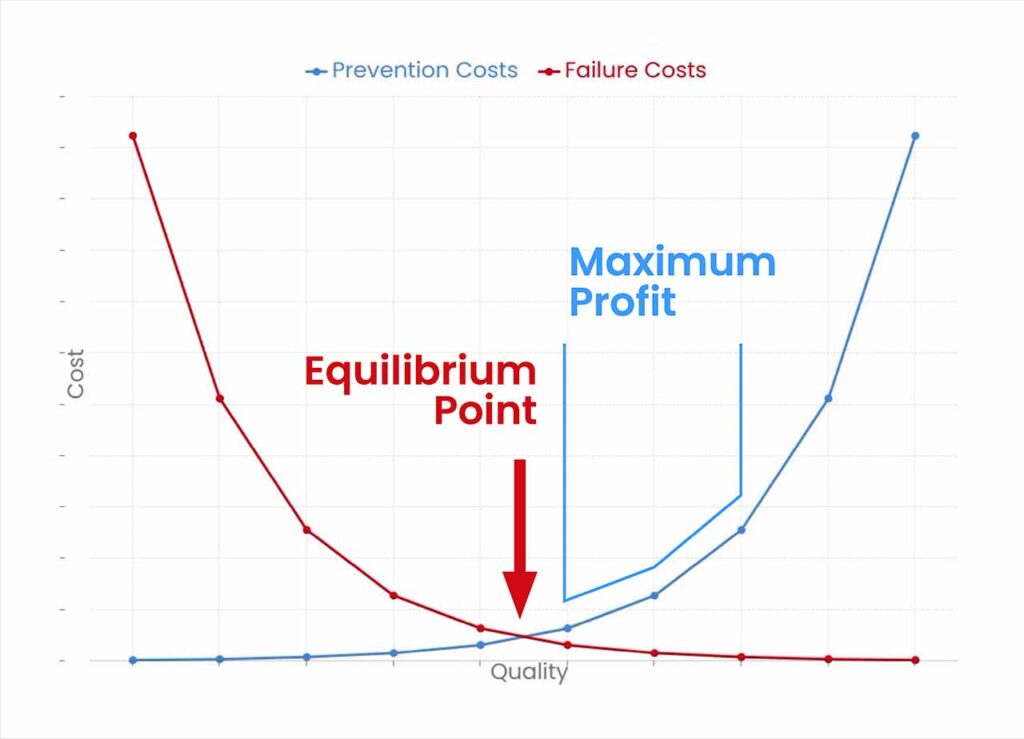
To determine the point at which maximum profit occurs, the product, sales, finance, and marketing teams must work together to project a forecast of sales volume at different price and quality levels. This is usually somewhere to the right of the equilibrium point due to increases in demand as a result of higher quality.
The Cost of Quality System
Cost of Quality (COQ) systems can be highly effective. However, not without continual enforcement. Examples of successful cost of quality system implementations include Xerox, who reported a savings of $210 million in 4 years of implementation. (Carr, 1995). Dow Chemical reported a savings of $1.5 billion, attributing quality systems as responsible for these savings. (Dow, 1999).
Likewise, simply measuring cost will not generate results. Systematic changes are necessary to move up the quality scale. Measurement simply illustrates where issues are, and how effective your changes are. It does not cause any effective change without implementing changes. Both must be in place simultaneously.
Examples of Quality Systems
ISO 9000 Principles of Quality Management:
The ISO 9000 family of quality management standards is a set of principles based on the premise of continuous improvement. Products, services, and processes are under constant scrutiny and evaluated for efficiency, effectiveness, and compliance.
- Customer focus. This is the goal of meeting customer requirements.
- Leadership. Leaders in any organization must engage employees through equipping and empowering them and recognizing their contributions.
- Engagement of people. Ensure that each employee’s abilities are utilized to their maximum (no lost potential.)
- Process approach. All activities are managed as a process and linked together as a whole system.
- Improvement. The continual approach of aligning new improvement activities with measurements.
- Evidence-based decision making. All decisions must involve accurate and reliable data and analysis.
- Relationship management. Partners and suppliers are managed through sharing and continuous optimization.
Baldrige Excellence Framework:
The Baldrige Excellence Framework is the highest quality recognition
a company can receive in the United States. It is an evaluation of a system within a company and includes 7 areas within the examination of the framework.
- Leadership
- Strategy
- Customers
- Measurement, analysis, and knowledge management
- Workforce
- Operations
- Results
Gap Framework:
This framework is based entirely in customer satisfaction. It includes five major satisfaction gaps to address in order to meet customer expectations.
- Management and customer
- Individual and company goals
- Procedure and execution
- Company promise and follow-through
- Customer expectation and experience
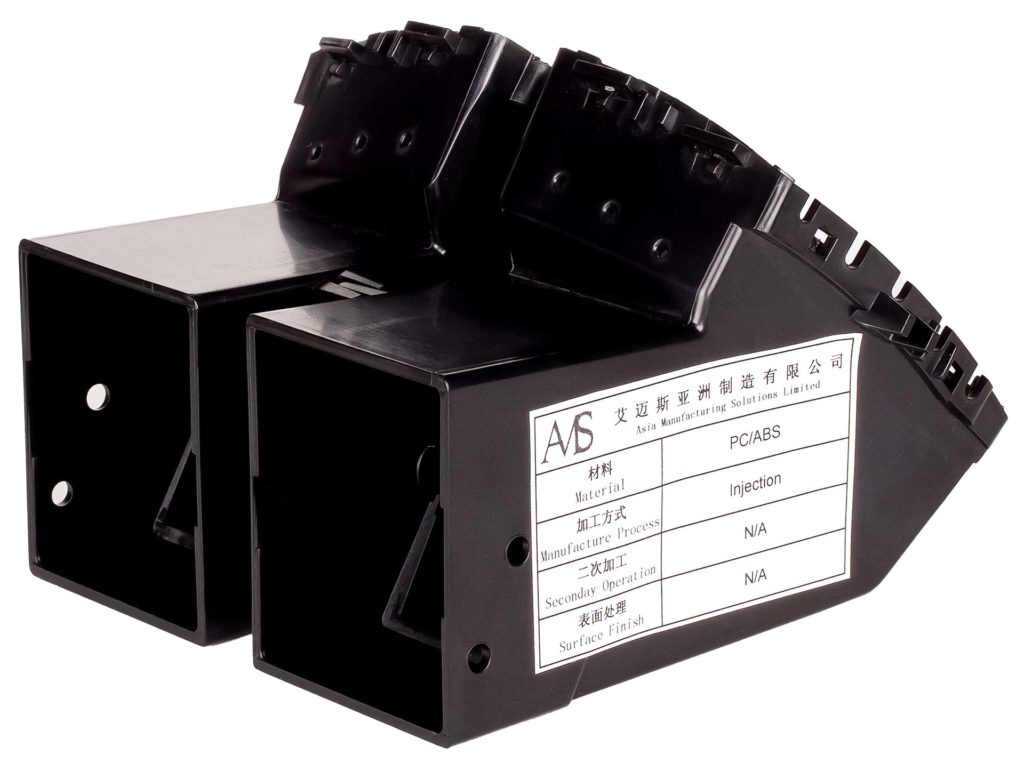
How AMS Does Quality
From the beginning, we engineered quality into our manufacturing process. We are ISO 9001 certified and employ the principles of “Kaizen”. We strive to reduce steps in our process that do not add value.
Additionally, we have undying devotion to adhering to spec. This means our job is not to “get creative” when it comes to a pre-defined specification. We will of course make recommend optimizations, but ultimately our job is to build a product that meets our customers needs exactly.
We also make sure to DFM (design for manufacturing) every project that we work on. This helps ensure your parts are manufacturable before you incur losses. If you are looking for a manufacturing partner, let us show you what we are capable of.
Start your quality journey by getting a free DFM report from our experienced team of engineers.
Conclusion: The Cost of Quality
Cost of Quality (COQ) is highly crucial for lowering an organizations failure costs and optimizing prevention costs. The earlier in the process that quality is addressed, the better the overall profitability and the lesser the chances of the snowball effect.
Many frameworks exist for this process, you need to decide which one(s) are appropriate for your organization. Measurement and continual improvement are crucial to the success of any framework.
References:
Dow Chemical. 1999. 1999 Annual Report to Shareholders.
Carr, L. 1995. “How Xerox Sustains the Cost of Quality.” Management Accounting 76(2) (August): 26- 32.
With our quality-focused manufacturing system, AMS is the best suited partner for your mass production requirements. Our in-house engineering team provides expert DFM reporting to ensure your products perfectly conform to your specification.